Written by Allen Wyatt (last updated December 19, 2020)
This tip applies to Excel 2007, 2010, 2013, 2016, 2019, and Excel in Microsoft 365
Ken has two charts on a worksheet, both with the horizontal axis displayed as dates. (The charts are very similar.) One of the charts allows the Bounds options for the horizontal axis to be modified and the other chart doesn't offer the Bounds options at all. Ken wonders what causes the difference between these two very similar charts and how he can set the start and end dates without the Bounds options.
First, let's assume that the two charts are based on different sets of data in the worksheet. In this case the problem may well be rooted in the data on which the problem chart is based. You see, the Bounds option will only be available if Excel determines that the data on which the axis is based contains all dates. If Excel detects that the data contains something different (such as text), then it doesn't present the Bounds option. So, check the data and make sure it actually contains dates, refresh (or regenerate) the chart, and the problem should disappear.
If the two charts are based on the exact same data, then the problem is just a bit trickier. Follow these steps:
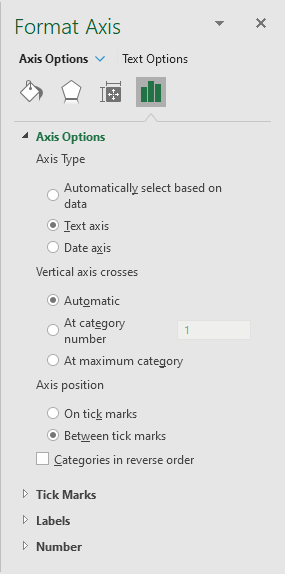
Figure 1. The Format Axis pane.
Note the setting near the top of the pane, under the Axis Type category. If the axis type is set to Text, then the Bounds options are not visible. You'll want, instead, to choose either of the other two options.
The trick to displaying the Bounds options is to make sure you select the axis type that is appropriate for your data and to make sure that your data contains just dates.
ExcelTips is your source for cost-effective Microsoft Excel training. This tip (13813) applies to Microsoft Excel 2007, 2010, 2013, 2016, 2019, and Excel in Microsoft 365.
Program Successfully in Excel! John Walkenbach's name is synonymous with excellence in deciphering complex technical topics. With this comprehensive guide, "Mr. Spreadsheet" shows how to maximize your Excel experience using professional spreadsheet application development tips from his own personal bookshelf. Check out Excel 2013 Power Programming with VBA today!
When creating a chart, you may want to adjust the default scaling that Excel applies to an axis. This is relatively easy ...
Discover MoreIf you need to create a chart that uses logarithmic values on both axes, it can be confusing how to get what you want. ...
Discover MoreOnce you create a chart, you aren't limited to keeping the data series in the order they originally appeared. You can ...
Discover MoreFREE SERVICE: Get tips like this every week in ExcelTips, a free productivity newsletter. Enter your address and click "Subscribe."
2023-04-13 14:23:18
Dave
In order to find the offending date range complete a trim on the whole range of dates in another cell. You should see it almost immediately which is not a date. Then at that point convert the cell to date format. Then look at the list of "numerical date representations" one or more will have text or some other format. Change these to date entries and your boundaries should show up for you when you fry to format the axis.
2022-04-21 01:12:34
Paul Skayman
Hi,
I have a wacky problem with bounds. I have prepared 2 charts and both have almost the same (1 is a subset of the other) horizontal axis label points. They are all dates (everything is a formula (cell above + 7) and checked as date format. One has bounds as a format option and the other doesn't. The subset doesn't have bounds and the complete dataset does.
It's driving me crazy!
I'd be happy to send the spreadsheet if that helped. I look forward to any advice that you may have.
Best,
2021-08-27 12:14:28
TM21
That was an excellent tip - all of my graphs were showing the bounds limits except one.
And I did have one X-axis label that wasn't a date - remove that and I can see the bound limits again.
Many thanks!
Got a version of Excel that uses the ribbon interface (Excel 2007 or later)? This site is for you! If you use an earlier version of Excel, visit our ExcelTips site focusing on the menu interface.
FREE SERVICE: Get tips like this every week in ExcelTips, a free productivity newsletter. Enter your address and click "Subscribe."
Copyright © 2024 Sharon Parq Associates, Inc.
Comments