Please Note: This article is written for users of the following Microsoft Excel versions: 2007 and 2010. If you are using an earlier version (Excel 2003 or earlier), this tip may not work for you. For a version of this tip written specifically for earlier versions of Excel, click here: Reordering the Display of a Data Series.
When you create a chart in Excel, you may have a need to change the order in which the data series are displayed in the chart. One way to do this, of course, is to change the order of the data in the underlying worksheet range. For instance, you can sort the data in the worksheet range, and the change in order should be reflected in the chart based on that data.
Another way is to manually customize the chart to rearrange the data series. Follow these steps:
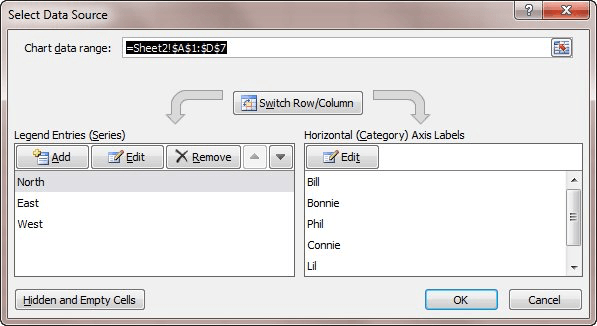
Figure 1. The Select Data Source dialog box.
ExcelTips is your source for cost-effective Microsoft Excel training. This tip (6237) applies to Microsoft Excel 2007 and 2010. You can find a version of this tip for the older menu interface of Excel here: Reordering the Display of a Data Series.

Program Successfully in Excel! This guide will provide you with all the information you need to automate any task in Excel and save time and effort. Learn how to extend Excel's functionality with VBA to create solutions not possible with the standard features. Includes latest information for Excel 2024 and Microsoft 365. Check out Mastering Excel VBA Programming today!
When you want to change the defaults used for charts, a chart template is the way to go. This tip shows how easy it is to ...
Discover MoreOne type of chart that Excel allows you to create is one that occupies an entire worksheet. When it comes time to print ...
Discover MoreMacros allow you to make changes to virtually anything you can see in Excel. This tip examines how to make changes (even ...
Discover MoreFREE SERVICE: Get tips like this every week in ExcelTips, a free productivity newsletter. Enter your address and click "Subscribe."
2018-02-06 07:34:50
me
And how do I do this in vba scrip???
2018-01-16 03:23:02
gerdami
Unfortunately, after having reordered the data series, a click on the chart no longer shows the data range.
2015-06-08 11:19:09
Sophie
Allen, I tried this in Excel 2013, but all the options under Legend Entry (Series) are greyed out.
2014-05-21 12:53:32
Surendera M. Bhanot
People do not know much about the harts and Graph maipulations. The Tips recently appearing are making us wiser. Thanks Allen Wyatt for bringing them to us.
Got a version of Excel that uses the ribbon interface (Excel 2007 or later)? This site is for you! If you use an earlier version of Excel, visit our ExcelTips site focusing on the menu interface.
FREE SERVICE: Get tips like this every week in ExcelTips, a free productivity newsletter. Enter your address and click "Subscribe."
Copyright © 2026 Sharon Parq Associates, Inc.
 Please Note:
This article is written for users of the following Microsoft Excel versions: 2007 and 2010. If you are using an earlier version (Excel 2003 or earlier), this tip may not work for you. For a version of this tip written specifically for earlier versions of Excel, click here:
Please Note:
This article is written for users of the following Microsoft Excel versions: 2007 and 2010. If you are using an earlier version (Excel 2003 or earlier), this tip may not work for you. For a version of this tip written specifically for earlier versions of Excel, click here:
Comments