Written by Allen Wyatt (last updated January 6, 2024)
This tip applies to Excel 2007, 2010, 2013, 2016, 2019, 2021, and Excel in Microsoft 365
Barbara uses conditional formatting to highlight when one number is not equal to another number. She is working with dollars, so she only cares about the numbers being equal to the penny. Since Excel looks out to more decimal places, $100.00 may not be equal to $100.00 at the fifth decimal place and conditional formatting highlights the numbers as being unequal. The only way Barbara has been able to overcome this is by writing two formatting rules saying it is OK if the difference is within a range. She wonders if there is an easier way.
The easiest solution to this is to change the formulas used to generate the values so that they are rounded. For instance, let's say you have a formula that sums a range of cells. All you need to do is to change the formula so that the result of the sum is rounded:
=ROUND(SUM(F2:F27),2)
If you are comparing rounded results in your worksheet, then you'll get the proper comparisons you desire.
Another approach is to change the formula used in your conditional formatting rules. Instead of checking if two values are equal, check if the rounded version of the two values is equal. As an example, if your conditional formatting rule compares the values stored in B6 and C6, you could change the rule to use this formula:
=ROUND(B6,2)=ROUND(C6,2)
Still another approach is to modify the precision that Excel uses. As Barbara is aware, Excel does its calculations at a high level of precision, which is why she may have problems resulting from results at the fifth decimal place. Instead, you can modify how the calculations are done in this manner:
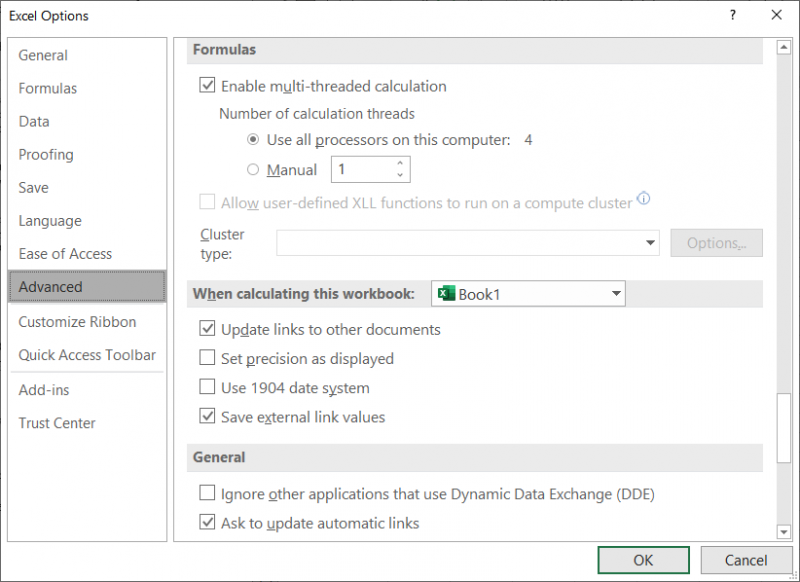
Figure 1. The Advanced options in the Excel Options dialog box.
Now, Excel uses the precision shown on the screen in all of its calculations, instead of doing calculations at the full 15-digit precision it normally maintains. The benefit is that you don't have to then use the ROUND function in your formulas—you just change the formatting of the cells so that the desired number of decimal places are displayed.
ExcelTips is your source for cost-effective Microsoft Excel training. This tip (9175) applies to Microsoft Excel 2007, 2010, 2013, 2016, 2019, 2021, and Excel in Microsoft 365.

Program Successfully in Excel! This guide will provide you with all the information you need to automate any task in Excel and save time and effort. Learn how to extend Excel's functionality with VBA to create solutions not possible with the standard features. Includes latest information for Excel 2024 and Microsoft 365. Check out Mastering Excel VBA Programming today!
If you have conditional formatting applied in a worksheet, the formulas in those formats may not be as secure as you ...
Discover MoreConditional formatting is a great tool for changing how your data looks based on the data itself. Excel won't allow you ...
Discover MoreConditional formatting can be easily set up to check data on the current worksheet. If you want to check data on the ...
Discover MoreFREE SERVICE: Get tips like this every week in ExcelTips, a free productivity newsletter. Enter your address and click "Subscribe."
2024-01-08 17:24:10
Dave Bonin
I sometimes use ABS( B6 - C6 ) < 0.001
This keeps it a one-way comparison and it doesn't matter which value might be slightly bigger or smaller.
2024-01-06 18:16:44
Dave
Your two methods could give you different results since precision as displayed rounds before summing.
2024-01-06 10:11:41
J. Woolley
My Excel Toolbox includes the PrecisionAsDisplayed() function to return the status of a workbook's calculation precision (TRUE if 'AsDisplayed' or FALSE if 'Standard'). For example:
="Precision is "&IF(PrecisionAsDisplayed(),"'AsDisplayed'","'Standard'")
My Excel Toolbox also includes the TogglePrecision macro to switch between the two possibilities.
See https://sites.google.com/view/MyExcelToolbox/
For more on this subject, see https://excelribbon.tips.net/T013765_Permanently_Turning_On_Set_Precision_As_Displayed.html
Got a version of Excel that uses the ribbon interface (Excel 2007 or later)? This site is for you! If you use an earlier version of Excel, visit our ExcelTips site focusing on the menu interface.
FREE SERVICE: Get tips like this every week in ExcelTips, a free productivity newsletter. Enter your address and click "Subscribe."
Copyright © 2026 Sharon Parq Associates, Inc.
Comments