Aziz once accidently pressed something while working with a PivotTable, which then expanded every row in the PivotTable to its own sheet. After he got over the surprise, he found that this was very helpful in examining his data. Problem is, he cannot figure out what it was that he accidently pressed so that he can again do this on other PivotTables.
There are actually a couple of ways to expand the data in a PivotTable, but none of them involve keyboard shortcuts. One way to expand the data is to double-click on a value in the PivotTable. Excel creates a new worksheet that provides detail for the value on which you clicked. For example, if you double-click on a value in a row of the PivotTable, then Excel creates a worksheet that contains all the values that make up that original row value. (Remember that PivotTables are used to consolidate information; they provide totals of information, so double-clicking "expands" that total so you can see what makes it up.)
Also, if you double-click on a grand total in a PivotTable, Excel creates worksheets for each row that is included in that grand total. (This sounds the closest to what happened with Aziz.)
There is another way to expand information in a PivotTable, through the use of Report Filter pages. When you create a PivotTable, if you put a field within the Report Filters section of the PivotTable, then you can later expand information to multiple worksheets based on that field. Follow these steps:
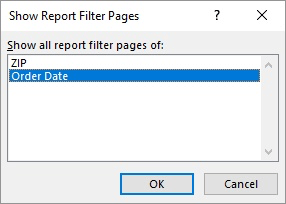
Figure 1. The Show Report Filter Pages dialog box.
At this point, Excel creates separate PivotTable worksheets for each of the discrete values in the field you selected in step 4. (For some data sets, this can be quite a few worksheets.)
ExcelTips is your source for cost-effective Microsoft Excel training. This tip (12198) applies to Microsoft Excel 2007, 2010, 2013, 2016, 2019, and 2021.

Best-Selling VBA Tutorial for Beginners Take your Excel knowledge to the next level. With a little background in VBA programming, you can go well beyond basic spreadsheets and functions. Use macros to reduce errors, save time, and integrate with other Microsoft applications. Fully updated for the latest version of Office 365. Check out Microsoft 365 Excel VBA Programming For Dummies today!
PivotTables are great for aggregating and analyzing tons of raw data. If you want to see what changes in the PivotTable ...
Discover MoreA PivotTable is a great way to aggregate and analyze data. Sometimes, though, it can be difficult to figure out how to ...
Discover MoreWhen you update a PivotTable, Excel can take liberties with any formatting you previously applied to the PivotTable. ...
Discover MoreFREE SERVICE: Get tips like this every week in ExcelTips, a free productivity newsletter. Enter your address and click "Subscribe."
2022-01-19 15:53:41
Jessica
"which then expanded every row in the PivotTable to its own sheet"
I came across this page when searching for how to do this. I couldn't find the answer here, but I did figure out how, so I figured I'd share it with you.
Take the field that you want separated into separate sheets, and put it into the filter section instead of row section. Stay with me here.
Now put the next item in the Values or Rows field. You could use the same field you put in the filter section or a different one; that will vary need by need.
Once you have that. Be sure you are in the PivotTAble Analyze tab, and look for a button that says options. I wish I could post pictures. You'll have a series of choices labeled Pivot Table, Active Field, Group, Filter Etc. - it's in the section labeled pivot table. It's labeled options. Hit that down menu and choose 'Show Report Filter Pages'. Highlight the filter choice that you want separated on each sheet. Click okay, and you're done.
I know it's a lot of steps. I wish I could post pictures. Hope this helps!
2019-04-07 13:50:16
Bo
This happened to me too! I accedentally created a very helpful table without knowing how I did it. Thank you for showing me what to do next time I need it.
2018-05-01 05:09:21
hillp
Excel 2010
almost to what im looking for, but not quite...i just want to list all raw data inside a separate sheet from the master pivot table.
the method that you share above just create another pivot table in every sheet....
think as pivot table to summarize data... and from that summary i want to generate individual sheet of raw data based on the category i analysed in the pivot table
any other option? VBA maybe?
Got a version of Excel that uses the ribbon interface (Excel 2007 or later)? This site is for you! If you use an earlier version of Excel, visit our ExcelTips site focusing on the menu interface.
FREE SERVICE: Get tips like this every week in ExcelTips, a free productivity newsletter. Enter your address and click "Subscribe."
Copyright © 2026 Sharon Parq Associates, Inc.
Comments