Paul generates a lot of XY plots in Excel. Sometimes he wants to change the colors of the markers and lines of one series to match those of another series. He would like to match the "automatic" colors that Excel applies, but Paul hasn't found a way to get a list of the RGB values for the "automatic" colors. When he manually selects colors for a series a dialog box opens showing theme colors, standard colors, and recent colors. Oddly, none of these are the same as the automatic colors. Paul wonders if anyone knows how to identify the RGB values of Excel's automatic colors.
To discover a chart line's RGB value, as assigned by Excel, follow these steps if you are using Excel 2013 or a later version:
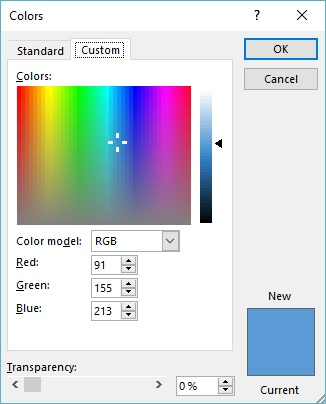
Figure 1. The Custom tab of the Colors dialog box.
The RGB values shown in the dialog box are the values for the currently selected data series. Jot them down and then you can close all the dialog boxes and the task pane.
The above steps (or their equivalent, adjusted for interface differences) won't work in Excel 2007 or Excel 2010. The reason is because Excel doesn't make the Color tool available in the Format Data Series dialog box as it does in Excel 2013 and later versions. (The tool is hidden if the line type is set to Automatic.) So, you must resort to a different technique.
Perhaps the quickest way to find out the RGB values of a color is to use a specialized tool outside of Excel. A class of tool known as a "color picker" can be used to show the color of any pixel on the screen—including those used in a chart line. The following are a few different color pickers you can check out:
http://www.blacksunsoftware.com/colormania.html
http://instant-eyedropper.com
https://www.picpick.org
This list of suggestions isn't exhaustive, by any means. You should be able to do a web search for "color picker" (with the quotes) and find literally scores of such utilities.
When working with automatic colors in charts, remember that Excel can and often does change them whenever a chart is regenerated. (They are automatic, after all.) This is particularly true if you change a single data series so it is no longer automatic of if you add to or remove from the chart's underlying data.
ExcelTips is your source for cost-effective Microsoft Excel training. This tip (12632) applies to Microsoft Excel 2007, 2010, 2013, 2016, 2019, 2021, and Excel in Microsoft 365.

Dive Deep into Macros! Make Excel do things you thought were impossible, discover techniques you won't find anywhere else, and create powerful automated reports. Bill Jelen and Tracy Syrstad help you instantly visualize information to make it actionable. You�ll find step-by-step instructions, real-world case studies, and 50 workbooks packed with examples and solutions. Check out Microsoft Excel 2019 VBA and Macros today!
Excel allows you to create custom chart formats that go beyond the standard formats provided in the program. These custom ...
Discover MoreExcel can display both values and names for data points in a chart, when you hover the mouse over the data point. This ...
Discover MoreNeed a chart that uses two lines for axis labels? It's easy to do if you know how to set up your data in the worksheet, ...
Discover MoreFREE SERVICE: Get tips like this every week in ExcelTips, a free productivity newsletter. Enter your address and click "Subscribe."
2025-06-09 09:23:42
J. Woolley
See https://learn.microsoft.com/en-us/windows/powertoys/color-picker
2025-06-08 04:36:09
SAndeep
Interesting.
Got a version of Excel that uses the ribbon interface (Excel 2007 or later)? This site is for you! If you use an earlier version of Excel, visit our ExcelTips site focusing on the menu interface.
FREE SERVICE: Get tips like this every week in ExcelTips, a free productivity newsletter. Enter your address and click "Subscribe."
Copyright © 2026 Sharon Parq Associates, Inc.
Comments