Written by Allen Wyatt (last updated March 2, 2024)
This tip applies to Excel 2007, 2010, 2013, 2016, 2019, 2021, and Excel in Microsoft 365
David would like to add a line at a particular slope and for a particular length in his workbook. This should be a line shape, not a chart. he would like to specify a slope (such as 34 degrees) and a length (such as 3.5 inches) and have that line appear within the workbook. He wonders if there is a way to get that precise with line shapes and, if so, how he can do it.
You can create the desired line either manually or with a macro. To do it manually, follow these steps:
The other settings in the pane don't really matter that much. It is the Width and Rotation settings that are the important ones.
If you want to use a macro to create the desired line, here is an easy way to do it:
Sub DrawLine()
    Dim dLength As Double
    Dim dAngle As Double
    Dim x1 As Single
    Dim y1 As Single
    Dim x2 As Single
    Dim y2 As Single

    ' Use upper-left corner of active cell as starting point
    x1 = ActiveCell.Left
    y1 = ActiveCell.Top

    ' Grab length and angle from noted cells
    dLength = Range("B4").Value
    dAngle = Range("B5").Value
    dLength = Application.InchesToPoints(dLength)
    dAngle = WorksheetFunction.Radians(dAngle)   ' Convert degrees to radians

    x2 = x1 + dLength * Cos(dAngle)
    y2 = y1 - dLength * Sin(dAngle)

    ' Insert a line object of 4 points thickness
    With ActiveSheet.Shapes.AddLine(x1, y1, x2, y2).Line
        .Weight = 4
    End With
End Sub
This macro reads the contents of cells B4 and B5 each time it is run to determine, respectively, the length and angle of the desired line. Each time you run it, it also adds a new line. Because of this, you'll want to select a different cell each time you run it because the line starts at the upper-left corner of the selected cell.
Also, note that the manual steps described earlier start with a line that is horizontal. The macro, however, creates a line that is at the desired angle and length—it doesn't start from a horizontal position. This means that if you select the macro-created line and display the Format Shape pane, the Width and Rotation settings won't match what you might expect. The angle and length of the macro-created line are correct, however.
Now, one more thing to keep in mind: Shapes in Excel are often approximate, not exact. This is particularly true if you print out the worksheet that includes the line. You might get out your protractor and find that the line isn't exactly at 34 degrees or find that your ruler indicates it isn't exactly 3.5 inches. This has to do with lots of variables relative to display and printing of graphics, and there is very little that can be done about it. The best bet is to either accept the approximation or play around with the lines until you get them to appear (or print) exactly as you expect.
ExcelTips is your source for cost-effective Microsoft Excel training. This tip (11796) applies to Microsoft Excel 2007, 2010, 2013, 2016, 2019, 2021, and Excel in Microsoft 365.

Professional Development Guidance! Four world-class developers offer start-to-finish guidance for building powerful, robust, and secure applications with Excel. The authors show how to consistently make the right design decisions and make the most of Excel's powerful features. Check out Professional Excel Development today!
Macros are a great way to process information in a worksheet. Part of that processing may involve moving graphics around ...
Discover MoreExcel allows you to capture portions of your worksheet as a picture that you can then use in a variety of other ways. ...
Discover MoreExcel provides some great tools that allow you to create amazing charts based on data in your worksheets. Once your ...
Discover MoreFREE SERVICE: Get tips like this every week in ExcelTips, a free productivity newsletter. Enter your address and click "Subscribe."
2025-06-22 20:24:24
pj
all good, thanks J
working great on my application, solved the quadrant issue, doing nautical navigation and plotting true course, current, and compensated course
got to love the range of solutions excel allows for those who unlock its huge capabilities
thanks again, very much appreciate you taking the time and thinking....
2025-06-22 16:38:21
pj
thx J
I was over thinking it and overlooked my right angle triangle formulas, thank you
I guess I need to figure out which quadrant to handle the correct orientation but that should be straight forward with some if statements
2025-06-22 12:21:13
J. Woolley
@pj
Search Google for Pythagorean Theorem:
c^2 = a^2 + b^2
If x1 < x2, let
a = y2 - y1
b = x2 - x1
c = SQRT(a^2 + b^2) = Length of line
A = ATAN(a/b) = Slope of line (radians)
A = DEGREES(ATAN(a/b)) = Slope of line (degrees)
2025-06-22 03:48:15
pj
Any thoughts on how to determine length and angle (slope) of a line shape usine vba?
The reverse of this calculation if you will, given 4 points x1, y1, x2, y2
2024-03-02 17:37:28
Tomek
@J. Woolley
Re: How it prints depends on the printer.
This is only partially true. While the printer may be off from 100% scale, the main distortion is caused by Excel. See my comment below.
2024-03-02 17:21:08
Tomek
Excel is seriously flawed when it comes to handling sizes of shapes, pictures and other graphic elements. What's more, it is very inconsistent in that regard.
Let me start with three different views available in Excel and impact of the particular view selection on the size of a graphic element. I created a blank spreadsheet opened in normal view and set the page orientation to landscape to have enough space. then I inserted two objects:
- a picture 800x800 at 200 dpi. I made sure its size was exactly 4.00x4.00 inches
- a rectangle sized to 4.00x4.00 inches.
I set my zoom to match the screen size to the nominal size (in my case 107%).
I set both objects to "Don't size or move with cells", then I switched the view to Page Layout. Sizes of both object somehow changed to 4.07x4.27" (all dimensions shown here as HxW). This is a significant distortion. Back to normal view and the sizes were back to original.
Switching to Page Break Preview they became 4.07x4.01"
When printed to pdf, using Microsoft Print to pdf, both object had the size of 3.95x4.29". Even bigger distortion. Almost identical when printed on my EPSON WF-7510.
You could probably reverse engineer the object sizes in your spreadsheet to get what you want in a printout, but realistically, Excel is not meant for handling graphic elements sizes and proportions.
It is even more unpredictable when inserting shapes over a chart.
BTW, the printed cell sizes also do not match their settings in spreadsheet. Also, the column widths set in pixels in Normal view become wider in pixels in Page Layout view. For example a square cell 400x400 pixels becomes 400x425, and is no longer square.
The page layout view is closest to the printout, but the graphic elements and cells are still squishes to about 96% size vertically.
2024-03-02 11:36:50
J. Woolley
An Excel shape's Rotation is measured clockwise from its original position. The Tip's step 8 sets Rotation of the horizontal line to 34, which gives it negative slope (toward South-East); setting Rotation to -34 gives it positive slope (toward North-East).
The Tip's DrawLine macro results in positive slope when the angle (cell B5) is positive.
The Tip says, "Shapes in Excel are often approximate, not exact." My Excel Toolbox includes the DisplayScreenMetrics macro to show metrics for your current monitor's screen (see Figure 1 below) . It computes the zoom factor necessary for displaying Excel's Page Layout in actual size. (In my case it is 92%.) With that zoom factor, Excel's 3.5 inch line measures 3.5 inches on the screen (as close as possible). How it prints depends on the printer.
My Excel Toolbox also includes the following function to return individual metrics for the current monitor's screen:
=DisplayScreen(Item)
where Item is text identifying the metric to return or "Help" for a comma separated list of recognized Items. For example,
=DisplayScreen("AdjustmentFactor")
returns the applicable zoom factor.
See https://sites.google.com/view/MyExcelToolbox/
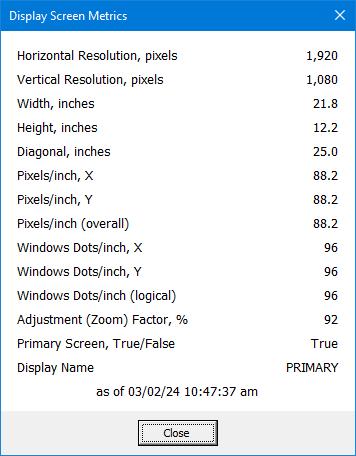
Figure 1.
Got a version of Excel that uses the ribbon interface (Excel 2007 or later)? This site is for you! If you use an earlier version of Excel, visit our ExcelTips site focusing on the menu interface.
FREE SERVICE: Get tips like this every week in ExcelTips, a free productivity newsletter. Enter your address and click "Subscribe."
Copyright © 2025 Sharon Parq Associates, Inc.
Comments