Madeleine has a worksheet that includes a number of charts. She needs to create a JPG file that contains one of those charts. She is looking for the best way to create a high-quality JPG from the chart.
There are actually a good number of ways you can perform this task. Before mentioning them, though, it should be mentioned that if you want "high quality," you may not want to use JPG. The reason is simple—JPG is considered a "lossy" file format. This means that when you save as JPG, some of your quality may be lost, depending on how compressed you choose to make the image file. Instead, seek to save your images in a "lossless" format, such as PNG or TIF. If you absolutely need to have the JPG format, you could always convert the PNG or TIF file to JPG, which means you then still have the higher-quality image file available for later use.
To save your chart in a graphics format (be it JPG or one of the others), one approach is to pass the image through either Word or PowerPoint. Follow these general steps:
You can also use the Snipping tool (an accessory available in Windows) to capture just about anything that appears on your screen. The advantage of this approach is that you are actually capturing the chart at the full resolution of what you see on your screen. You can find out more about the Snipping tool on this page:
https://windows.tips.net/T012558
To capture a larger version of your chart with the Snipping tool, you can adjust the zoom setting in Excel before actually doing the capture.
Another approach is to create a PDF of your chart. Assuming you have Adobe Acrobat on your system (you'll want to check; not everyone does), you can then load the PDF file and choose to export it as a JPG file. This produces an image that is just as high a quality as what you see when you look at the PDF file.
Of course, you could use other third-party graphics programs to get your chart into a graphics format. The steps are similar to those detailed earlier:
If you need to save your charts as graphics quite a bit, you might want to consider using a macro to do the exporting directly. Here's how you do it:
Sub SaveChartAsJPG()
    Dim sFileName As String

    sFileName = ThisWorkbook.Path & "\" & ActiveChart.Name & ".jpg"
    ActiveChart.Export Filename:=sFileName, FilterName:="JPG"
End Sub
This macro results in the currently selected chart being saved in the same folder in which the workbook is saved. If you decide you would rather save your chart in PNG format, then all you need to do is change "jpg" to "png" and "JPG" to "PNG".
For additional ideas about how to save your charts in a graphics format, you may be interested in this page:
https://www.ablebits.com/office-addins-blog/2013/08/27/save-excel-chart-as-image/
ExcelTips is your source for cost-effective Microsoft Excel training. This tip (1775) applies to Microsoft Excel 2007, 2010, 2013, 2016, 2019, 2021, and Excel in Microsoft 365.

Professional Development Guidance! Four world-class developers offer start-to-finish guidance for building powerful, robust, and secure applications with Excel. The authors show how to consistently make the right design decisions and make the most of Excel's powerful features. Check out Professional Excel Development today!
Macros are a great way to process information in a worksheet. Part of that processing may involve moving graphics around ...
Discover MoreIf you use Excel to keep a graphic with each row of data you amass, you may wonder if there is a way to easily delete the ...
Discover MoreA common way of representing data is to use a Venn diagram. Unfortunately, Excel doesn't have a precise way of creating ...
Discover MoreFREE SERVICE: Get tips like this every week in ExcelTips, a free productivity newsletter. Enter your address and click "Subscribe."
2023-01-14 18:55:54
Tomek
J. Woolley:
Option Save as Picture is indeed available in 365 (I don't know about earlier versions), but to get it on context menu you must select the whole chart ***only***, not including any of its elements. It is easy to miss.
Make sure to click close to the frame of the graph. It works for both embedded graphs and those on separate Graph sheets.
Which brings interesting, albeit somewhat academic, question: If you scale the embedded graph beyond what is visible on screen (say 3 screens high and two screens wide), do you get better resolution?
The answer is yes, but beware - the titles and labels may need re-sizing before saving to be readable.
2023-01-14 18:30:41
Tomek
Beware that sometimes pasting images into Word or PowerPoint reduces the quality of the picture. To avoid Fuzzy images in Word or PowerPoint Options - Advanced - in section Image Size and Quality - check the option Do not compress images in file. Alternatively set the Default resolution to High fidelity or whatever highest option is available on your machine. Or just to be sure do both. (see Figure 1 below)
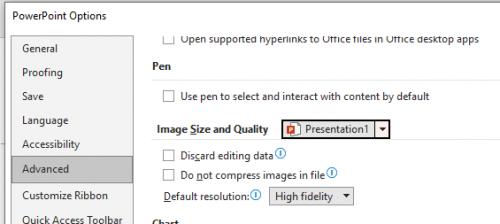
Figure 1.
2023-01-14 10:21:45
J. Woolley
When I right-click a chart on a worksheet (in Excel 365), one of the choices is "Save as Picture..." which makes it easy to save in any of the typical graphic formats.
Got a version of Excel that uses the ribbon interface (Excel 2007 or later)? This site is for you! If you use an earlier version of Excel, visit our ExcelTips site focusing on the menu interface.
FREE SERVICE: Get tips like this every week in ExcelTips, a free productivity newsletter. Enter your address and click "Subscribe."
Copyright © 2026 Sharon Parq Associates, Inc.
Comments