Accessing Stock Information

Written by Allen Wyatt (last updated May 5, 2023)
This tip applies to Excel 2007, 2010, 2013, 2016, 2019, and Excel in Microsoft 365


11

Tony likes to keep track of his relatively small stock portfolio in an Excel worksheet. He's been manually entering stock values, but now Tony is wondering if there is a way to have stock prices update automatically in the worksheet.

Keeping track of stock information is, for many people, a common task in Excel. If you are using Office 365, Microsoft recently (end of March 2019) made it possible to add dynamic stock information to a worksheet. (The capability was actually added last year, but it wasn't fully rolled out to all Office 365 users until March 2019.) All you need to do is follow these general steps:

  1. In a column of your worksheet, type the stock symbols for the companies for which you want data. For instance, you might type MSFT, AAPL, TSLA, AMD, or GOOG into the cells. (You should place only one company stock symbol per cell.)
  2. Display the Data tab of the ribbon.
  3. Select the cells containing the stock symbols. (See Figure 1.)
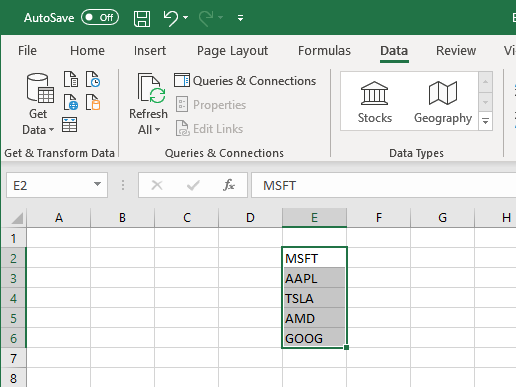
  4. Figure 1. Ready to grab stock information in Excel.

  5. Click the Stocks tool in the Data Types group. Excel converts the stock symbols to the full company names, the exchange name, and the stock symbol. (See Figure 2.)
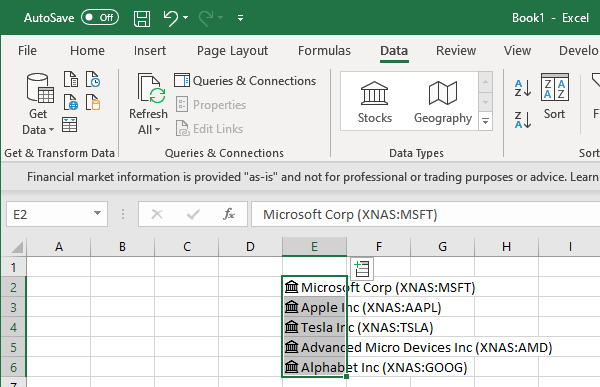
  6. Figure 2. The stock symbols are converted to fuller information.

  7. It is possible that not all of the stock symbols will convert. This is especially true if there is some ambiguity as to what particular stock you want with the symbol you entered. In that case, Excel displays at the right side of the screen a task pane that allows you to specify, exactly, which stock you want.
  8. With the cells still selected, click the small icon that appears at the upper-right of the selected cells. Excel displays an assortment of statistics available for the stocks. (There are quite a few; you can scroll down to see them all.) (See Figure 3.)
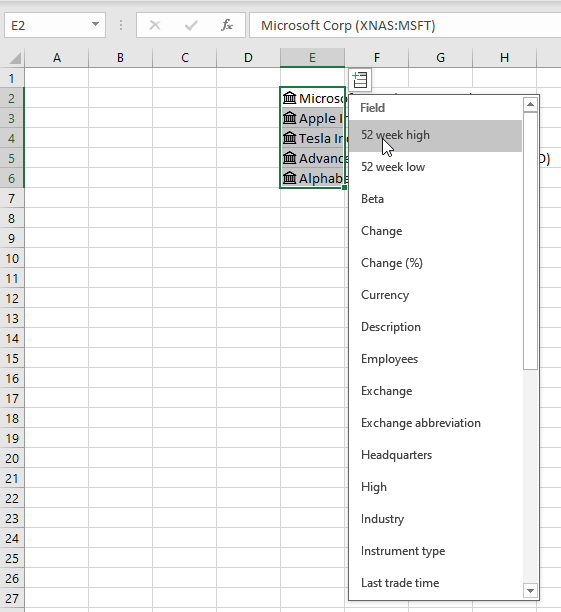
  9. Figure 3. Data available about your stocks.

  10. Pick the statistic you want to display in the worksheet. Excel adds it just to the right of the stock symbol cells; the stock symbol cells remain selected. (See Figure 4.)
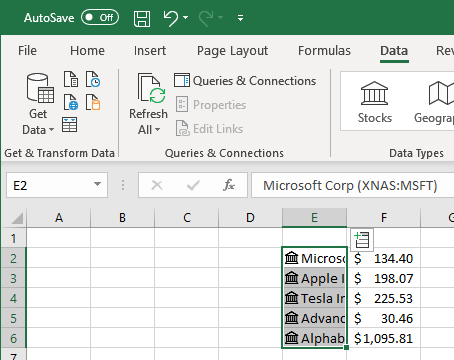
  11. Figure 4. Stock prices added to the right of the stock symbols.

  12. Repeat steps 6 and 7 to continue adding statistics about the stocks. Excel adds each new statistic to the right of the existing statistics.
  13. Adjust column widths and add your own column headings above the stock information, as desired.

That's it; you now have your dynamic stock information in your worksheet. That's not all, though. You'll notice that immediately to the left of the stock symbols (in the same cell) there is a small icon. This is called a "card," and if you click on it, you'll see summary information about the stock. (See Figure 5.)

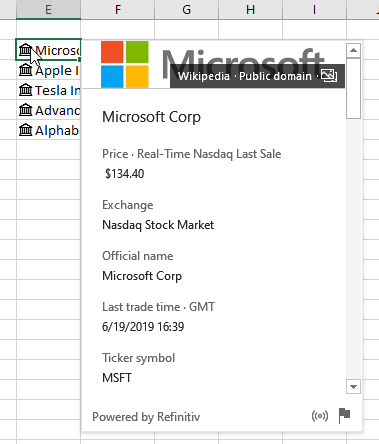
Figure 5. Displaying the card information for a stock.

According to Microsoft, the information provided by this stock capability is real-time. More information about this can be found at this terribly long URL:

https://www.microsoft.com/en-us/microsoft-365/blog/2019/06/05/stocks-data-type-microsoft-nasdaq-refinitiv-empower-investors-with-real-time-data/

You should note that one of the drawbacks of the built-in stocks in Excel is that they won't work with foreign exchanges. They are great, however, for US stock exchanges.

What if you aren't using Office 365 or you need the capability to access foreign stock information? Are you out of luck? Not really, but your available solutions won't be as integrated into Excel as you might like. You can, for instance, use PowerQuery to extract stock information from a website and store it in a worksheet.

You could also add a third-party tool to do the grabbing and analysis for you. ExcelTips subscribers have suggested the following possible tools:

https://www.quotelink.net/
http://www.michael-saunders.com/stocksapp/pages/info.html
https://www.powerusersoftwares.com/so/8fMbYWA94

We haven't tried these tools out, but they (and other similar tools) may work for your purposes.

ExcelTips is your source for cost-effective Microsoft Excel training. This tip (13646) applies to Microsoft Excel 2007, 2010, 2013, 2016, 2019, and Excel in Microsoft 365.

Author Bio

Allen Wyatt

With more than 50 non-fiction books and numerous magazine articles to his credit, Allen Wyatt is an internationally recognized author. He is president of Sharon Parq Associates, a computer and publishing services company. ...

MORE FROM ALLEN

Adjusting Column Width Using Menus

If you want to resize the width of your table columns, you can do it using a mouse, but you can get more precise widths ...

Discover More

Deleting Files or Folders

Part of managing the files and folders on a system is the need to occasionally delete them. Here's a quick discussion on ...

Discover More

Resizing Checkboxes

If you create a user form in VBA that includes checkboxes, you may want to make the checkboxes larger. You can't adjust ...

Discover More

Program Successfully in Excel! John Walkenbach's name is synonymous with excellence in deciphering complex technical topics. With this comprehensive guide, "Mr. Spreadsheet" shows how to maximize your Excel experience using professional spreadsheet application development tips from his own personal bookshelf. Check out Excel 2013 Power Programming with VBA today!

More ExcelTips (ribbon)

Inserting the User's Name in a Cell

Need to understand who is using a particular workbook? There are a number of ways you can find out, as discussed in this tip.

Discover More

Working with Record Numbers

Want to keep track of various rows in a data table through the use of record numbers? Here are some options and ...

Discover More

Speeding Up Large Worksheets

If your worksheet gets large enough, you may notice a severe slowdown when it is recalculated. This tip provides some ...

Discover More
Subscribe

FREE SERVICE: Get tips like this every week in ExcelTips, a free productivity newsletter. Enter your address and click "Subscribe."

View most recent newsletter.

Comments

If you would like to add an image to your comment (not an avatar, but an image to help in making the point of your comment), include the characters [{fig}] (all 7 characters, in the sequence shown) in your comment text. You’ll be prompted to upload your image when you submit the comment. Maximum image size is 6Mpixels. Images larger than 600px wide or 1000px tall will be reduced. Up to three images may be included in a comment. All images are subject to review. Commenting privileges may be curtailed if inappropriate images are posted.

What is 2 + 8?

2023-05-09 10:35:07

J. Woolley

My Excel Toolbox includes the following two dynamic array functions that leverage the STOCKHISTORY function in Excel 365:
=StockAsOfDate(Stock, Property, AsOfDate, [SkipHeader])
=StockEndOfPeriod(Stock, Property, Period, [SkipHeader])
Each function returns a Stock's recent Property as of the given date or at the end of a given period. (The second function utilizes the first; the first function utilizes STOCKHISTORY.)
If Stock references ticker symbol text (like "MSFT") or a cell with Stocks data type, the equity's default exchange will be used; for a specific exchange, add the 4-character ISO market identifier code (MIC) followed by a colon (like "XNAS:MSFT").
Property must be a digit or text (ignoring alphabetic case) identifying which value to return:
0 or "Date" for most recent previous trade Date (non-holiday weekday)
1 or "Close" for Date's closing trade price
2 or "Open" for Date's opening trade price
3 or "High" for highest trade price during Date
4 or "Low" for lowest trade price during Date
5 or "Volume" for trade volume during Date
6 or 7 or 8 are NOT VALID
9 or "All" for an array with all 6 properties listed above in 6 columns; otherwise, the array will have 1 column
AsOfDate must be a date serial number or text representing a valid date:
If AsOfDate < today, results will refer to that date's end-of-day
If AsOfDate = today, results will refer to yesterday's end-of-day
If AsOfDate > today, #VALUE! (error 2015) will be returned
Period must be text (ignoring alphabetic case) specifying the most recent end of a previous sequence:
"Day" for last trading day before today
"Week" for last trading day before the most recent Sunday (or before today if today is Saturday) assuming trading for the current week ends on Friday
"Month" for last trading day before the first day of the current month
"Year" for last trading day before the first day of the current year
"Quarter" for last trading day before the first day of the current quarter
"Q1" for last trading day before the most recent Apr 1
"Q2" for last trading day before the most recent Jul 1
"Q3" for last trading day before the most recent Oct 1
"Q4" for last trading day before the most recent Jan 1
If optional SkipHeader is False (default), the dynamic array result will have 2 rows; otherwise, it will have 1 row.
See https://sites.google.com/view/MyExcelToolbox/


2023-05-08 09:26:14

Tomek

In my Excel 365 Family I had to customize the Ribbon by adding Data Types to it. It wasn't there by default, but once added worked as described.

Great tip Allen.


2020-05-31 07:28:21

Brett

John Smith, for the S&P you can S&P 500 use the text "S&P 500 Index" it is there and it does work - it's just a bit tricky to find. Still cant find the FTSE data through


2020-05-30 15:42:35

Nick Gray

Steps 6 and following do not work, at least for Office 365.


2020-04-17 08:30:25

John Smith

Hi, I have been trying to get S&P500 and Russell 2000 data for months. Yes I can get DJIA and NASDAQ. But not SP and Russell. Please help!

Thank you.


2020-03-03 05:51:27

Brett

Hi there,

using this Excel feature, what is the code to lookup the UK FTSE 100 index?
https://www.bloomberg.com/quote/UKX:IND
I can find the code for the Australian ASX 200 index "S&P/ASX 200" - it looks up this index and I can get the data I need from it - but I can't get it to find the reference for the FTSE?
Any help is greatly appreciated.

Thanks


2019-06-30 09:05:35

Allen

Nicholas,

The screen shots in the tip -- showing the Stocks data type -- are from an Office 365 installation on a Windows system. The same thing shows on my Office 365 on Mac, as well. You may want to make sure you are logged in to your Microsoft account and that you check for updates that may be available for Office 365.

-Allen


2019-06-30 00:18:26

Nicholas Gray

I am using Offie365 and the DATA tab DOES NOT have a "Stocks" Data Type. I have tried to find it elsewhere and am at a lost. Can I do this with excel in Office365? If so, how can I do it?


2019-06-25 06:06:08

Brian Rowe

Thank you for the tip Allen.

Contrary to your comment, it is indeed possible to obtain information for non US stocks. I have just downloaded stock details from both the UK's FTSE 100 and FTSE 250 indexes.

Additionally, where a stock ticker is utilised on different indexes, (e.g. AGR is the ticker for Avangrid on the NYSE and Assura on the FTSE 250), you can right click on the cell, select data type, followed by change, and select the correct stock from the appropriate index.


2019-06-22 06:02:49

Andy

If you don't have access to Office 365, another alternative is Google Sheets, which have had stock price functionality since 2010!

https://support.google.com/docs/answer/3093281?hl=en

The examples at the bottom of the page give the basic usage.


2019-06-22 05:35:01

George Stowe

I use Office 365 ProPlus. Can't see the Data Types tab. None of the suggestions from MS work.

Too bad, because this is a great tip and one I wanted to use.

Thanks for the great weekly tips!!


This Site

Got a version of Excel that uses the ribbon interface (Excel 2007 or later)? This site is for you! If you use an earlier version of Excel, visit our ExcelTips site focusing on the menu interface.

Newest Tips
Subscribe

FREE SERVICE: Get tips like this every week in ExcelTips, a free productivity newsletter. Enter your address and click "Subscribe."

(Your e-mail address is not shared with anyone, ever.)

View the most recent newsletter.