Please Note: This article is written for users of the following Microsoft Excel versions: 2007, 2010, 2013, 2016, 2019, 2021, and Excel in Microsoft 365. If you are using an earlier version (Excel 2003 or earlier), this tip may not work for you. For a version of this tip written specifically for earlier versions of Excel, click here: Preparing a Chart Sheet for Printing.
Excel allows you to use two types of charts: embedded charts and chart sheets. Since an embedded chart is included as part of a regular worksheet, you can print one just as you would any other worksheet.
Chart sheets, on the other hand, take a bit more preparation in order to print. To modify how a chart sheet appears, display the Page Layout tab of the ribbon and click the small icon at the lower-right of the Page Setup group. Excel displays the Page Setup dialog box. Make sure you select the Chart tab; there you can select the quality of the printout and specify if you want to print the chart in black and white or not. (See Figure 1.)
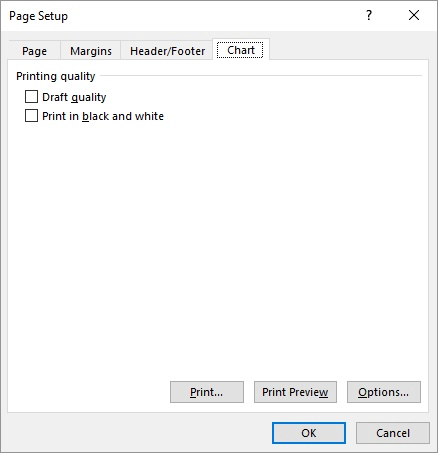
Figure 1. The Chart tab of the Page Setup dialog box.
If you don't see a Chart tab in the Page Setup dialog box, then you don't have a chart sheet displayed. Remember that the chart tab only appears of you have a Chart sheet selected.
As with any other graphics image, you can resize a chart sheet. As you move the mouse pointer over the sizing handles that appear around a selected chart sheet, the mouse pointer changes to a sizing arrow. Click on a sizing handle and drag the border of the chart to reflect the size you want to use. The direction of the arrowheads indicates the direction you can move the border. When you release the mouse button, the chart is resized and redrawn automatically.
ExcelTips is your source for cost-effective Microsoft Excel training. This tip (11915) applies to Microsoft Excel 2007, 2010, 2013, 2016, 2019, 2021, and Excel in Microsoft 365. You can find a version of this tip for the older menu interface of Excel here: Preparing a Chart Sheet for Printing.

Professional Development Guidance! Four world-class developers offer start-to-finish guidance for building powerful, robust, and secure applications with Excel. The authors show how to consistently make the right design decisions and make the most of Excel's powerful features. Check out Professional Excel Development today!
Want a cool, small chart to show what your data is doing? You need a sparkline, discussed in this tip.
Discover MoreIf you add callouts using the drawing tools in Excel, you may have noticed that they don't always stay where you expect ...
Discover MoreIf the data you are using as the source for a chart includes some cells that are empty, you may want to exclude those ...
Discover MoreFREE SERVICE: Get tips like this every week in ExcelTips, a free productivity newsletter. Enter your address and click "Subscribe."
There are currently no comments for this tip. (Be the first to leave your comment—just use the simple form above!)
Got a version of Excel that uses the ribbon interface (Excel 2007 or later)? This site is for you! If you use an earlier version of Excel, visit our ExcelTips site focusing on the menu interface.
FREE SERVICE: Get tips like this every week in ExcelTips, a free productivity newsletter. Enter your address and click "Subscribe."
Copyright © 2026 Sharon Parq Associates, Inc.
 Please Note:
This article is written for users of the following Microsoft Excel versions: 2007, 2010, 2013, 2016, 2019, 2021, and Excel in Microsoft 365. If you are using an earlier version (Excel 2003 or earlier), this tip may not work for you. For a version of this tip written specifically for earlier versions of Excel, click here:
Please Note:
This article is written for users of the following Microsoft Excel versions: 2007, 2010, 2013, 2016, 2019, 2021, and Excel in Microsoft 365. If you are using an earlier version (Excel 2003 or earlier), this tip may not work for you. For a version of this tip written specifically for earlier versions of Excel, click here:
Comments