Please Note: This article is written for users of the following Microsoft Excel versions: 2007, 2010, 2013, 2016, 2019, and 2021. If you are using an earlier version (Excel 2003 or earlier), this tip may not work for you. For a version of this tip written specifically for earlier versions of Excel, click here: Excel Charts in PowerPoint.
Written by Allen Wyatt (last updated March 23, 2023)
This tip applies to Excel 2007, 2010, 2013, 2016, 2019, and 2021
If you do a lot of presentations, you may deal with many large data reports that include charts and graphs that summarize data for your audiences. Sometimes you may need to add these charts and graphs to PowerPoint presentations.
The problem with doing a simple copy and paste of a chart from Excel to PowerPoint is that although you only see the chart in the PowerPoint slide, the entire workbook is copied into PowerPoint as well. If someone double-clicks the chart in the slide, PowerPoint will open the entire Excel workbook.
This poses a couple of problems. First, unless the PowerPoint file has been password protected (not really an option for mass distribution) a user could easily adjust the data feeding into the chart and corrupt accuracy.
Secondly, since the entire Excel workbook is copied into the PowerPoint file, this can dramatically increase the total size on the PowerPoint file, possibly making it too cumbersome for distribution.
One simple solution is to modify how the pasting into PowerPoint is done. Follow these steps:
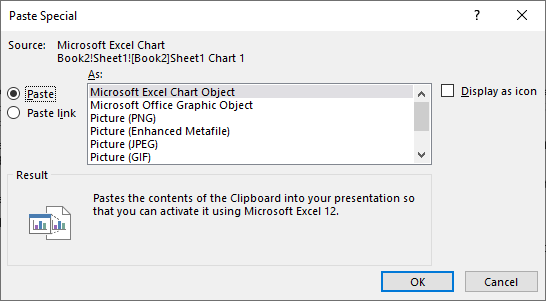
Figure 1. The Paste Special dialog box in PowerPoint.
This time, only the image of the chart is pasted into the slide. This maintains the accuracy and security of your chart and significantly reduces the size of your PowerPoint presentation.
ExcelTips is your source for cost-effective Microsoft Excel training. This tip (13109) applies to Microsoft Excel 2007, 2010, 2013, 2016, 2019, and 2021. You can find a version of this tip for the older menu interface of Excel here: Excel Charts in PowerPoint.
Excel Smarts for Beginners! Featuring the friendly and trusted For Dummies style, this popular guide shows beginners how to get up and running with Excel while also helping more experienced users get comfortable with the newest features. Check out Excel 2013 For Dummies today!
Excel allows you to add trendlines to your charted data. It is possible, though, that lately you've been seeing a ...
Discover MoreWorking with elapsed times can be a bit tricky in some situations. One such situation involves the displaying of elapsed ...
Discover MoreExcel provides quite a bit of flexibility in how your chart looks. One of the least flexible places is in adjusting the ...
Discover MoreFREE SERVICE: Get tips like this every week in ExcelTips, a free productivity newsletter. Enter your address and click "Subscribe."
2019-07-02 09:48:52
MIchael Armstrong
I think this is true for copying a chart to Word as well. A long time ago I started pasting as picture, but I don't remember why I did it. Senectutem sugit.
2019-07-01 11:50:36
Neil
I seem to get the best resolution of the chart and the accurate copying of ancillary items that may have been added like an indication line or word box if I copy and paste into Paint and then select all and copy out of Paint into the PP. I'll have to try David's suggestion to see if it works the same with less trouble.
2019-07-01 04:43:40
David S
An alternative would be to select the chart and then use 'Copy as picture' rather than 'Copy'.
Got a version of Excel that uses the ribbon interface (Excel 2007 or later)? This site is for you! If you use an earlier version of Excel, visit our ExcelTips site focusing on the menu interface.
FREE SERVICE: Get tips like this every week in ExcelTips, a free productivity newsletter. Enter your address and click "Subscribe."
Copyright © 2025 Sharon Parq Associates, Inc.
 Please Note:
This article is written for users of the following Microsoft Excel versions: 2007, 2010, 2013, 2016, 2019, and 2021. If you are using an earlier version (Excel 2003 or earlier), this tip may not work for you. For a version of this tip written specifically for earlier versions of Excel, click here:
Please Note:
This article is written for users of the following Microsoft Excel versions: 2007, 2010, 2013, 2016, 2019, and 2021. If you are using an earlier version (Excel 2003 or earlier), this tip may not work for you. For a version of this tip written specifically for earlier versions of Excel, click here:
Comments